


A December Rate Hike Would Be Bad News For “SHUT” Stocks
By Adam Grossman, CFA, Doug Sandler, CFA, and Chris Konstantinos, CFA, RiverFront Investment Group
Last week the Federal Reserve left interest rates unchanged, as expected. However, the statement accompanying this decision and Fed Chairman Janet Yellen’s subsequent press conference sent strong signals that the Fed would like to raise rates before the end of the year. In addition, the Bank of Japan (BOJ) decided to not push overnight rates further below zero and to target a 0% yield on 10-year Japanese Government Bonds (JGBs). Yields on 10-year JGBs have been as low as -0.30% in recent weeks, so this new policy means generally higher long-term rates in Japan.
We believe that the actions of both the Fed and BOJ suggest that we may have seen the lows in global long-term interest rates. Falling interest rates have been one of the key factors supporting high valuations on high dividend SHUT stocks (Staples, Healthcare, Utilities, and Telecommunication), in our view. Stable to higher interest rates could keep downward pressure on these stocks.
RELATED: Japan: No Quick Fix, Lots of Long-Term Reforms; China: Lots of Quick Fixes, No Long-Term Reform
For the past few year, SHUT stocks have experienced the best of both worlds by fully participating in broad market strength while providing a degree of insulation during periods of market weakness. Throw in an attractive dividend in an environment where investors have been scrambling for yield, and it is not surprising that SHUT stocks have become so popular.
As investors, we are always wary of the latest investment fashion and are reminded that one of the cornerstones of our investment process is to “avoid the crowd at extremes”. Over the past six months we have been lowering our exposure to SHUT stocks in our portfolios. Our rationale for reducing exposure can best be summed up by saying they lack the “3 C’s” of an attractive investment: Condition, Catalysts, and Confirmation.
Condition: “Condition” is another way to say “value”. Since one of the basic tenets of investing is to buy low, and sell high, we are always looking to invest in things that are low and avoid things that are high in price. To distinguish between high and low prices, we rely on our Price Matters® tool, which has suggested that the US low volatility asset class (as defined by RiverFront’s Low Volatility Index) is more than 40% above its historical long-term trend line, as of August 31st. This asset class is heavily weighted to SHUT stocks. When asset classes trade significantly above their long-term trend line, investors should expect future returns to be meaningfully below normal until that overvalued condition is alleviated. The extent of the overvaluation of SHUT stocks was best described in our 8/15/16 Equity View, where we pointed out that the Technology sector and the Utility sector were being valued at roughly the same price to earnings (P/E) ratios, despite the significant differences in their growth prospects.
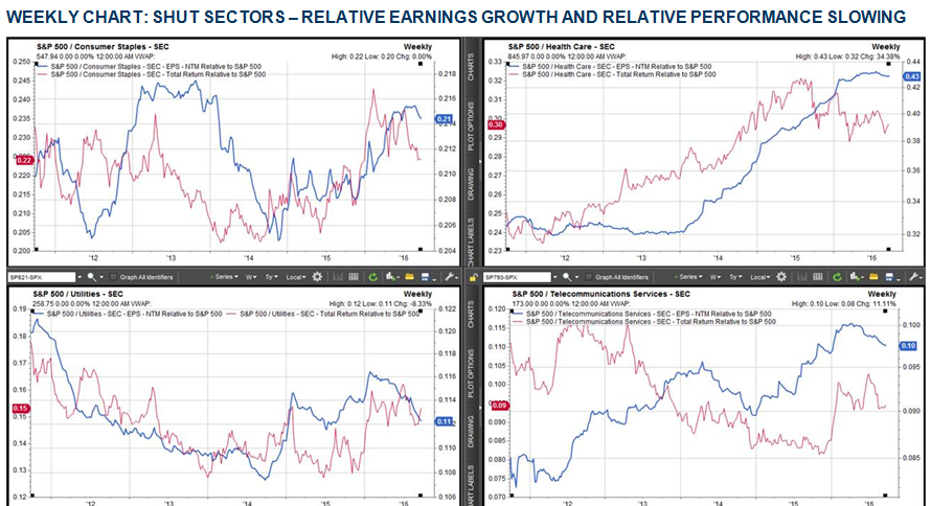
Catalysts: We believe there were two catalysts that drove the strong performance of SHUT stocks over the past few years. The first was earnings growth, which was stronger than the broad market for each of the 4 SHUT sectors since late 2014. The second was falling interest rates, which have historically had a positive impact on the share prices of companies operating in the SHUT sectors. Today, we believe these two catalysts are nearing exhaustion and may become a headwind to additional outperformance. This can be seen in the blue line for each SHUT sector in the Weekly Chart on page 2. This blue line shows the earnings per share growth for each of the SHUT sectors relative to the S&P 500. Without stronger-than-market earnings, we believe investors will have a difficult time justifying the elevated valuations of SHUT stocks. Additionally, we believe it unlikely that interest rates decline meaningfully from their current levels, given that the Federal Reserve has begun raising short-term rates.
The charts above show the relative earnings growth and relative total return for SHUT sectors relative to the broad market, as represented by the S&P 500 Index:
- Blue Line: The earnings per share growth of the S&P 500 Consumer Staples, Healthcare, Utility and Telecom sectors relative to the S&P 500
- Red Line: The total return of the S&P 500 Consumer Staples, Healthcare, Utility and Telecom sectors relative to the S&P 500
Confirmation: Since excessive valuation and negative catalysts can take time before negatively impacting a company’s share price, we like to see signs of “confirmation” before making meaningful changes to our portfolios. We believe we are beginning to see two early signs of confirmation that SHUT stocks are entering a difficult period. First, companies in SHUT sectors have begun to underperform the broad market in the third quarter (red lines in Weekly Chart). Second, SHUT stocks appear to no longer act defensively on days when the broad market is weak. While these confirmation signs are relatively recent and are too early to formulate into a discernable trend, we believe they are worth noting and should be viewed as an early warning indicator for our portfolios.
Bottom Line: We believe that RiverFront portfolios are well positioned for continued weakness in US SHUT stocks for three reasons. First, RiverFront’s selection discipline has a value bias, which causes us to seek to avoid the most overvalued of the SHUT stocks. Second, from an allocation perspective, our portfolios have less exposure to the SHUT sectors than their benchmarks. Finally, our sector allocations to non-SHUT sectors like Technology, Financials and Industrials are not meaningfully different from each portfolio’s respective benchmark. We believe these last two points are especially important, because many of the most popular investment strategies, like low volatility or dividend yield, are significantly overweight SHUT sectors and underweight non-SHUT sectors.
Adam Grossman, CFA, is Chief Global Equity Officer, Doug Sandler, CFA, is Chief U.S. Equity Officer, and Chris Konstantinos is the Director of International Portfolio Management, at RiverFront Investment Group, a participant in the ETF Strategist Channel.
Dividends are not guaranteed and are subject to change or elimination.
Low risk assets have typically have been defined as being in the Staples, Healthcare, Utilities, and Telecommunications industries.
RiverFront’s Price Matters® discipline compares inflation-adjusted current prices relative to their long-term trend to help identify extremes in valuation.
Technical analysis is based on the study of historical price movements and past trend patterns. There are no assurances that movements or trends can or will be duplicated in the future.
Technology and Internet-related stocks, especially of smaller, less-seasoned companies, tend to be more volatile than the overall market.
RiverFront Investment Group, LLC, is an investment adviser registered with the Securities Exchange Commission under the Investment Advisers Act of 1940. The company manages a variety of portfolios utilizing stocks, bonds, and exchange-traded funds (ETFs). RiverFront also serves as sub-advisor to a series of mutual funds and ETFs. Opinions expressed are current as of the date shown and are subject to change. They are not intended as investment recommendations.
Index Definitions:
RiverFront’s Low Volatility Index attempts to replicate the S&P 500® Low Volatility Index, using the CRSP Daily Historical Returns Series and Historical S&P Series. It is constructed by inverse volatility weighting the 100 least volatile stocks in the S&P 500 (meaning the least volatile stocks get the highest weights in the index). From 1926-1957, CRSP deciles 1-4 are used for the universe of stocks from which the index is constructed. From 1957 on, the S&P 500’s historical holdings are used.
Standard & Poor’s 500 Index (S&P 500) measures the performance of 500 large cap stocks, which together represent about 75% of the total US equities market.
It is not possible to invest directly in an index. Copyright © 2016 RiverFront Investment Group. All Rights Reserved.
This article was provided by our partners at ETFTrends.