


Wells Fargo and the Stress Test in 3 Charts
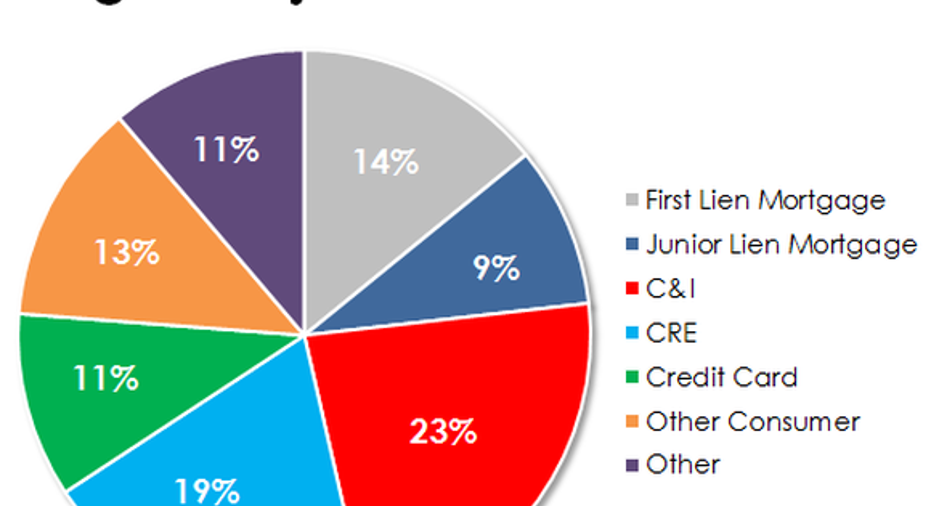
Image source: iStock/Thinkstock.
Given the turmoil surrounding the Brexit vote, most investors in Wells Fargo probably haven't had an opportunity to absorb how the bank performed on the 2016 Dodd-Frank Act supervisory stress test, the results of which were announced last Thursday. With this in mind, I drew up three charts to illustrate how the nation's third biggest bank by assets fared through the process.
1. Projected losses under the severely adverse economic scenario
The purpose of the annual stress test is to assess whether banks with $50 billion or more in assets on their balance sheets have enough capital to survive a severe economic downturn. The assumptions in this year's test, for instance, combine the worst aspects of the 2008 financial crisis and the 2011 European sovereign debt crisis.
The Fed assumed that, among other things:
- the unemployment rate increases to 10%
- U.S. gross domestic product falls by 6.5%
- stocks lose 50% of their value
- commercial real estate values drop by 30%
- home prices decline by 25%
- the rate on the 10-year Treasury falls to an unprecedented 0.25%
- short-term interest rates turn negative
After reading this list you may be surprised if any bank could survive this, much less all 33 of the banks tested this year, which was indeed the case. Though, to be clear, they didn't escape unscathed. The combined losses from the banks added up to $195 billion over the course of the stress test's nine-quarter scenario.
Data source: Federal Reserve. Chart by author.
Wells Fargo was among the banks with the highest projected losses, which is to be expected given that it's the nation's third largest. Over the nine-quarter stretch, the Fed estimates that Wells Fargo would lose $25.2 billion, the vast majority of which stem from loan losses.This goes to show how challenging the test is, as the California-based bank didn't report a single annual loss through the 2008 crisis.
2. Source of loan losses
According to the Federal Reserve's projections, Wells Fargo would lose more money from loan losses than any other bank in the country. That includes JPMorgan Chase and Bank of America, both of which have bigger balance sheets than Wells Fargo.
But this shouldn't be taken as a sign that Wells Fargo is a bad risk manager. It's a reflection instead of the fact that it has the country's largest loan portfolio. This distinction becomes clear when you consider that its loan losses equate to 5.4% of its total loans, which is less than the group average of 6.1%.
Where do Wells Fargo's loan losses stem from? As you can see in the chart below, the largest sources are commercial and industrial loans, followed by commercial real estate, and then first-lien residential mortgages.
Data source: Federal Reserve. Chart by author.
3. Capital ratio
The final chart cuts to the purpose of the stress test. That is, it shows the change in Wells Fargo's common equity tier 1 capital ratio from the beginning of the test to the end.
This is the most important chart of all, because a bank that's able to satisfy its regulatory capital requirements post-stress test can then seek the Fed's approval to increase its dividends and/or share repurchase program. And, rest assured, Wells Fargo cleared this hurdle.
Data source: Federal Reserve. Chart by author.
As you can see, Wells Fargo entered the test with a common equity tier 1 capital ratio of 11.1% and exited with a 7.2% ratio. That's a meaningful drop, but the latter figure nevertheless exceeded its 5.6% regulatory minimum.
The article Wells Fargo and the Stress Test in 3 Charts originally appeared on Fool.com.
John Maxfield owns shares of Bank of America and Wells Fargo. The Motley Fool owns shares of and recommends Wells Fargo. The Motley Fool recommends Bank of America. Try any of our Foolish newsletter services free for 30 days. We Fools may not all hold the same opinions, but we all believe that considering a diverse range of insights makes us better investors. The Motley Fool has a disclosure policy.
Copyright 1995 - 2016 The Motley Fool, LLC. All rights reserved. The Motley Fool has a disclosure policy.