


Dow 100,000 by 2035? History Suggests It's Quite Possible
This has been one truly wild year for investors. Over the course of just the first 10 trading days, the Dow Jones Industrial Average , the most iconic of all stock market indexes in the U.S., shed more than 8% of its value. This worked out to a drop of more than 1,400 points overall, and it was the worst beginning to a new year in recorded history.
For short-term traders it was an unprecedented move. However, for the long-term investor it was just another one of the many hiccups throughout the Dow's storied history.
Based on closing data for the Dow Jones Industrial Average aggregated by online website Gold Eagle, the Dow Jones spent roughly half of its days between 1900 and 2014 (31,156 total days) trading somewhere within 10% or less of a new all-time high. However, it's also spent nearly 21% of those days, around 6,500 days total, trading 40% or more below its last all-time high. The Great Depression is the primary culprit behind this statistic, but the housing bubble bursting in 2007 also played a role in adding to this total.
Dow 100,000? Not as far-fetched as you'd think
What's intriguing about this data is that no matter how far below its all-time high the Dow Jones Industrial Average dove, it eventually clawed its way back to a new all-time high. Sometimes this was accomplished within days or weeks. Or, as we saw with the Great Depression where the Dow lost 89% of its value in a span of three years, it took a good 25 years for the Dow Jones to recapture new all-time highs. In the end, though, the Dow continues to motor higher.
In fact, when taking into account dividend distributions and average returns per year, the 1930s is the only decade between the years 1900 and 2010 where the Dow posted a negative average rate of return per year (minus 0.63%). Comparatively, the Dow gained an average of 10% per year in the 1900s, 19% a year in the 1950s, nearly 18% annually in 1980s, and 18% per year in the 1990s. Had it not been for a dud of a decade in the 2000s where the average annual return was about 1%, the Dow could have a long-term rate of return in the double-digits. Nonetheless, between 1900 and 2010, the Dow's average annual rate of return is whopping 9.72% (remember, this includes dividend distributions).
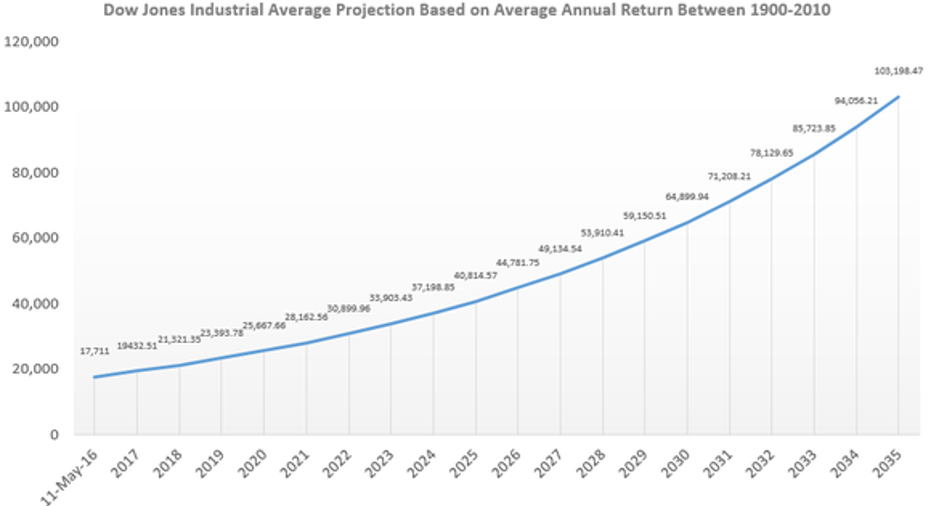
Here's what would happen if the Dow continued to deliver historic returns of 9.72% over the next 19 years based on its May 11, 2016 close of 17,711.
Chart and calculations by author based on 9.72% annual return, with the "new year" beginning on May 11.
Yes, you are seeing that correctly. If the Dow Jones Industrial Average were to keep to its historical return rate, dividends included, over the next 19 years, millennials and baby boomers could be looking at Dow 100,000 by 2035!
Now I want to be clear that historical data doesn't guarantee that the Dow will hit 100,000 by 2035. It's merely an average of what's happened to the Dow in the past, and as every single financial service reminds us without fail, "past performance is no guarantee of future results." But considering that the Dow is a dynamic index -- its components do change from time to time to reflect the rise and fall of certain industries comprised of 30 multinational giants that seem to grow with some regularity, Dow 100,000 within two decades doesn't seem all that far-fetched of an idea.
Two things to keep in mind
From the standpoint of an investor, the idea of Dow 100,000 means you have to keep two things in mind.
First, you have to remember that investing is a marathon and not a sprint. The Dow going from a value of well below 100 during the Great Depression to more than 18,000 recently is evidence to this point. What this means is we should be investing with the intent of holding for a long period of time. Buying and holding allows us to take advantage of compounding by reinvesting our dividends, as well as to benefit from long-term U.S. and global economic growth.
The other key point investors should remember is that the Dow is hardly ever "average." Even though the Dow has returned an average of 9.72% annually over a 110-year period, this doesn't mean investors should be expecting a nearly 10% gain in the Dow every year. If we've learned anything, it's that X-factors can come out of left field and completely surprise investors. In other words, we should expect periods of declines in the coming years or decades. Equally, we can probably expect some years to handily outperform the long-term increase of 9.72% per year. This is all the more reason not to try to time the market, but to instead buy quality companies and remain invested for long periods of time.
Do you think Dow 100,000 by 2035 is feasible? Share your thoughts in the comments below.
The article Dow 100,000 by 2035? History Suggests It's Quite Possible originally appeared on Fool.com.
Sean Williamshas no material interest in any companies mentioned in this article. You can follow him on CAPS under the screen nameTMFUltraLong, track every pick he makes under the screen name TrackUltraLong, and check him out on Twitter, where he goes by the handle@TMFUltraLong.The Motley Fool has no position in any of the stocks mentioned. Try any of our Foolish newsletter servicesfree for 30 days. We Fools may not all hold the same opinions, but we all believe thatconsidering a diverse range of insightsmakes us better investors. The Motley Fool has adisclosure policy.
Copyright 1995 - 2016 The Motley Fool, LLC. All rights reserved. The Motley Fool has a disclosure policy.