


5 Graphs CarMax, Inc. Investors Need to See
Even though CarMax posted a relatively strong fourth-quarter result Thursday, investors weren't thrilled with the figures and promptly sold the stock off by about 5%. Apparently, Deutsche Bank agreed, moving its price target from $72 to $67 Friday morning and maintaining its "hold" rating on the stock.
Investors need to keep some perspective on the results, and I'd like to offer a few graphs to provide somelong-termcontext for CarMax's business.
Let's take a look There have been concerns about margin pressure in the new- and used-vehicle sales market. Sure enough, that was evident in CarMax's fourth-quarter and full-year figures. However, investors should consider that gross profit per used unit has remained relatively unchanged, and near historic highs, for years.
Chart by author. Data source: CarMax investor resources.
And while CarMax's gross profit margins per used unit have declined slightly in recent years, investors should note that management has said all along it won't pad margins when the opportunity arises, because it believes passing on deals to consumers will make them customers for life.
Looking at full-year results over the long term, CarMax's average used unit price inched higher and remains at a record high. Meanwhile, total units continued an upward trend while the company continues to open new stores.
Chart by author. Data source: CarMax investor resources.
One thing investors weren't thrilled with was that even though the total units climbed higher, comparable-store sales growth slowed considerably. During the fourth quarter, CarMax's comparable-store sales grew only 0.7%, and for the full year it checked in at 2.4%.
Chart by author. Data source: CarMax investor resources.
Another thing investors should pay close attention to is how the company's SG&A expense compares with total revenue. CarMax is aiming to open about 15 stores per year, and each new store is obviously less efficient in operations at first, as well as more expensive, with all the necessary fresh marketing and advertising at the outset.
Chart by author. Data source: CarMax investor resources.
There was a slight uptick in SG&A percent of total revenue, but as long as it stays around the 9% mark, investors should remain optimistic about CarMax's overall growth story and earnings potential.
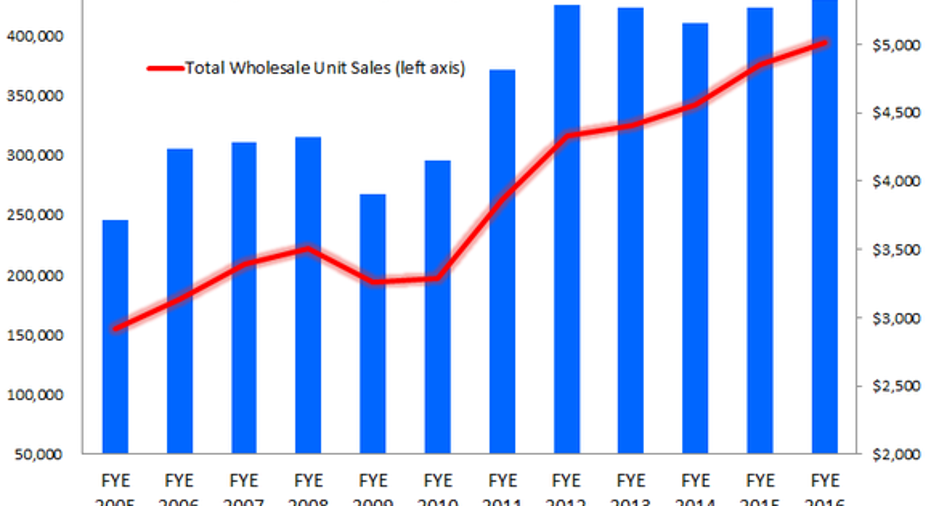
While used-vehicle sales obviously power the majority of CarMax's gross profit -- 66%, to be precise, for fiscal 2016 -- wholesale vehicle gross profit now generates nearly 20% of total gross profit. So investors looking to see CarMax expand its earnings potential beyond used-car sales should keep an eye on the following information.
Chart by author. Data source: CarMax investor resources.
Lastly, CarMax returned additional value to shareholders by repurchasing 3 million shares of common stock during the fourth quarter for $158.8 million; that brought the yearly total to 16.3 million shares for $971.2 million.
Ultimately, while growth slowed during the second half of CarMax's fiscal 2016, most of its data remains strong and/or near record highs. Make no mistake: CarMax's fourth quarter and fiscal 2016 were solid.
The article 5 Graphs CarMax, Inc. Investors Need to See originally appeared on Fool.com.
Daniel Miller has no position in any stocks mentioned. The Motley Fool recommends CarMax. Try any of our Foolish newsletter services free for 30 days. We Fools may not all hold the same opinions, but we all believe that considering a diverse range of insights makes us better investors. The Motley Fool has a disclosure policy.
Copyright 1995 - 2016 The Motley Fool, LLC. All rights reserved. The Motley Fool has a disclosure policy.