


The Most Dangerous States to Drive In
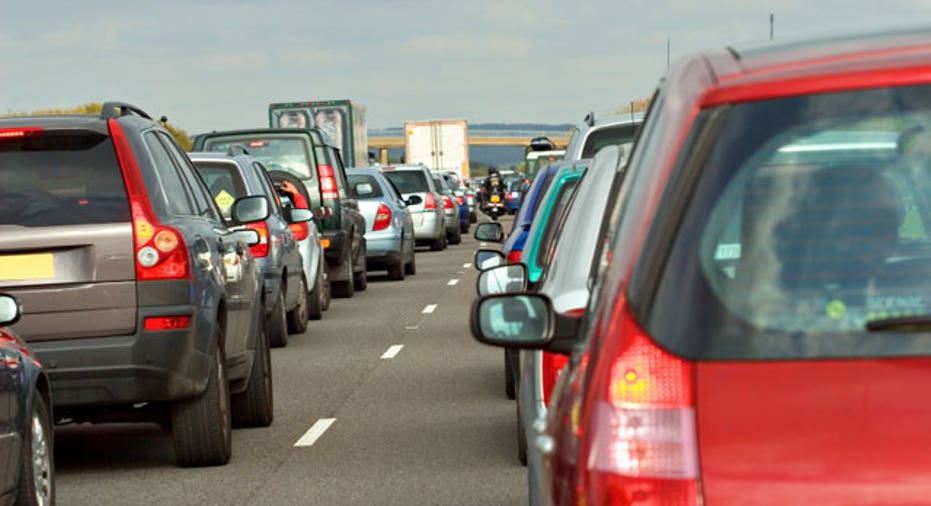
According to the U.S. Centers for Disease Control, more Americans aged five to 34 are killed in motor vehicle crashes than from any other single cause. Despite this disturbing fact, a study released this week shows that states where fatalities caused by car accidents are a major issue are doing the least to prevent them.
The Trust for America’s Health, a nonprofit disease prevention group, released a report earlier this month on various causes of injuries and deaths in the United States. Included in that report is a by-state analysis of CDC data on auto fatalities, the costs arising from all fatalities, and the policies states use to prevent car crashes. 24/7 Wall St. reviewed the 10 states that had the highest rates of auto fatalities.
Read: Cities with the Most Homes Underwater
Deaths caused by motor vehicle accidents in the U.S. range widely. Twelve states averaged less than 10 deaths per 100,000 people a year during 2007 to 2009. Massachusetts had the lowest average yearly rate in the country of just 5.5 per 100,000 people. On the other end of the spectrum, 14 states had at least three times as many deaths per 100,000 people. Mississippi had close to five times that rate.
A CDC report identified the estimated lifetime costs incurred by the states as the result of auto fatalities in a single year, including medical expenses and lost economic productivity. These two costs exceeded $170 billion in the U.S. in 2005, the most recent year data are available.
Read: Cities With The Most Homes In Foreclosure
With such high costs, and more importantly loss of life, the question is whether there is anything states can do to prevent car accidents. The Trust for America’s Health found that nothing works better to prevent traffic deaths than seat belt use. According to a report released by the National Highway Traffic and Safety Administration, six of the 10 states with the lowest seat belt usage rates also had the highest average auto fatality rates between 2007 and 2009.
The Trust for America’s Health report also identified four key policies labeled by the CDC as useful in improving traffic safety. The four include having a primary seat belt law (which allows police to stop and ticket unbuckled drivers without any other cause), a mandatory ignition interlock for all convicted drunk drivers, a mandatory motorcycle helmet law, and requiring booster seats for children eight years old and younger.
Read: The Happiest Countries in the World
Despite the massive financial burden auto accidents place on states each year, it appears many still fail to enact the kinds of basic safety laws that are believed to be instrumental in cutting down auto accidents deaths. In fact, it appears that the states with the highest rates of auto fatalities are missing some of those key policies. Of the 15 states with one or none of these policies in place, seven were among those with the highest fatality rates.
24/7 Wall St. ranked all 50 U.S. states based on the highest yearly average automobile deaths per 100,000 people from 2007 to 2009. 24/7 Wall St. also calculated the total costs incurred by state for these deaths using the CDC’s WISQAR report, which was for 2005. While the average auto mortality rate and the cost estimates are from different time periods, each are the most recently available data, and were used to approximate the actual costs of traffic deaths.
Read: Top Ten CEOs Sent to Prison
10. Kentucky > Average auto fatalities per 100,000: 18.3 > Auto fatalities/year: 784 (20th most) > Lifetime medical costs due to 1-yr. auto accidents: $6,410,980 (22nd highest) > Lifetime work loss costs due to 1-yr. auto accidents: $789,411,765 (19th highest) > Pct. commuters traveling 30 mins. or more: 28.39% (16th lowest)
From 2007 through 2009, Kentucky had an average of 18.3 motor vehicle-related fatalities for every 100,000 people a year. Although Kentucky is the nation’s 26th-most populous state, it had the 20th-highest number of auto fatalities each year over that time frame, averaging of 784 per year. It is estimated that Kentucky auto fatalities cost the state more than $789 million in lifetime work losses in a given year. The absence of laws mandating that motorcycle riders wear helmets and a failure to meet the American Academy of Pediatrics (AAP) standards requiring kids under eight years old to wear booster seats have both likely contributed to Kentucky’s poor record. To help encourage citizens to be safe drivers, police departments across the state have pledged to enforce the nationwide Click It or Ticket initiative in 2012.
9. Oklahoma > Average auto fatalities per 100,000: 19.5 > Auto fatalities/year: 711 (21st most) > Lifetime medical costs due to 1-yr. auto accidents: $5,896,988 (23rd highest) > Lifetime work loss costs due to 1-yr .auto accidents: $657,831,325 (22nd highest) > Pct. commuters traveling 30 mins. or more: 24.91% (10th lowest)
Oklahoma averaged 711 fatalities each year from auto accidents between 2007 and 2009, or 19.5 for every 100,000 residents. In one year, medical costs incurred from the state’s auto injury fatalities were estimated at just under $5.9 million. Oklahoma has yet to adopt mandatory ignition locks for all convicted drunk drivers, universal helmet laws for motorcyclists, or booster seat requirements for all children under eight. Oklahoma has had a primary seat belt law on the books since 1987, but fines first-time offenders only $20 for being unbuckled. Only seven states with primary seat belt laws levy lower fines. Recently, motor vehicle fatalities have actually increased. The Oklahoma Department of Public Safety reported an uptick in auto fatalities in March 2012. Compared to the same month last year, there were 20 more fatalities for a total of 59.
8. West Virginia > Average auto fatalities per 100,000: 19.8 > Auto fatalities/year: 359 (18th fewest) > Lifetime medical costs due to 1-yr, auto accidents: $2,938,686 (18th lowest) > Lifetime work loss costs due to 1-yr. auto accidents: $289,051,095 (16th lowest) > Pct. commuters traveling 30 mins. or more: 33.11% (17th highest)
Of the states with the highest auto fatality rates, West Virginia was one of the few with a large percentage of commuters traveling at least 30 minutes to work each day. Between 2007 and 2009, West Virginia averaged 359 auto fatalities each year, or 19.8 per 100,000 people. According to estimates, auto fatalities in one year cost the state $289 million in lost productivity. Of the four policies highlighted by the report, the state has adopted two — mandatory helmets and booster seats — but remains one of only 18 states that does not have a primary seat belt law.
7. Louisiana > Average auto fatalities per 100,000: 20.2 > Auto fatalities/year: 897 (15th most) > Lifetime medical costs due to 1-yr. auto accidents: $7,363,795 (18th highest) > Lifetime work loss costs due to 1-yr. auto accidents: $1,109,612,984 (8th highest) > Pct. commuters traveling 30 mins. or more: 31.71% (22nd highest)
Louisiana had the seventh-highest annual average rate of auto injury fatalities per 100,000 residents from 2007 to 2009, at 20.2. The estimated lifetime work loss costs due to fatalities from accidents in one year exceeded $1.1 billion, which is eighth highest, according to CDC estimates. Though Louisiana’s traffic safety figures are alarming, the state is taking steps to remedy the situation. It is one of only 16 states with a mandatory ignition lock for all convicted drunk drivers, one of 18 to make helmets mandatory for all motorcyclists, and one of 32 with a primary seat belt law. The problem, it seems, are not the laws but ineffective enforcement. According to an NHTSA report, only 75.9% of Louisiana drivers wore seat belts in 2010, the lowest among all states with primary seat belt laws.
6. South Carolina > Average auto fatalities per 100,000: 21.0 > Auto fatalities/year: 944 (13th most) > Lifetime medical costs due to 1-yr. auto accidents: $7,702,929 (16th highest) > Lifetime work loss costs due to 1-yr. auto accidents: $966,527,197 (12th highest) > Pct. commuters traveling 30 mins. or more: 31.11% (23rd highest)
Over the three-year span ending in 2009, South Carolina averaged 21 vehicle-related deaths per 100,000 people. Despite being the 24th-most populous state in the country, it had more auto fatalities than all but 12 other states. A single year of vehicle-related fatalities is estimated to cost the state more $7 million in lifetime medical expenses, and just under $1 billion in lost productivity. Likely contributions to South Carolina’s poor record are the absence of laws requiring all convicted drunk drivers to have ignition interlocks, motorcyclists to wear helmets, and children under eight to use booster seats. Additionally, the South Carolina Senate recently changed a bill that would have banned texting while driving for all drivers with one that prohibits texting only for drivers under 18.
5. Arkansas > Average auto fatalities per 100,000: 21.6 > Auto fatalities/year: 619 (22nd most) > Lifetime medical costs due to 1-yr. auto accidents: $4,775,033 (24th lowest) > Lifetime work loss costs due to 1-yr. auto accidents: $617,945,384 (24th highest) > Pct. commuters traveling 30 mins. or more: 26.02% (13th lowest)
Arkansas has the fifth-highest rate of auto injury fatalities. Between 2007 and 2009, the state averaged 21.6 fatalities per 100,000 residents per year. Arkansas has implemented a comprehensive highway safety plan for 2012. In the plan, the Highway Safety Office set specific goals for reducing DWI deaths, increasing seat belt usage, and slowing drivers down. The HSO hopes to accomplish these goals by bolstering training programs for law enforcement officials and educating the people through a series of high visibility campaigns.
Click here to read the rest of the story on 24/7 Wall St.